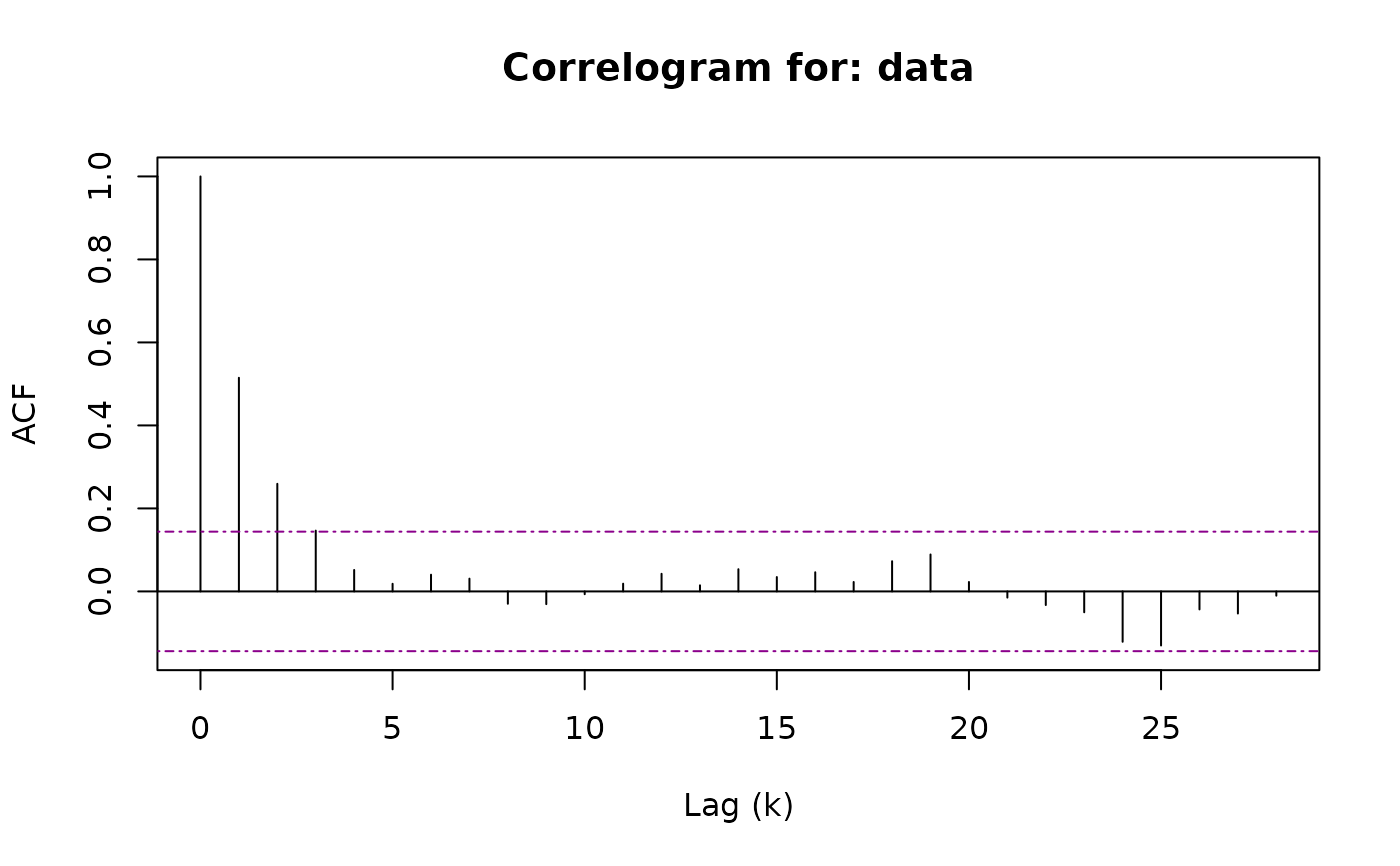
Plot Correlogram for Politis and White Auto\(-\)Correlation Implied Hypothesis Test
Source:R/plot.pwsd.R
plot.pwsd.RdS3 Method for objects of class 'pwsd'
See ?plot.acf of the stats package for more customization
options on the correlogram, from which plot.pwsd is based
# S3 method for class 'pwsd'
plot(x, c = NULL, main = NULL, ylim = NULL, ...)
Arguments
- x
an of object of class 'pwsd' or 'acf'
- c
a numeric value, the constant which acts as the significance level for the implied hypothesis test. Defaults to
qnorm(0.975)for a two-tailed 95% confidence level. Politis and White (2004) suggestc = 2.- main
an overall title for the plot, if no string is supplied a default title will be populated. See
title- ylim
a numeric of length 2 giving the y-axis limits for the plot
- ...
Arguments passed on to
base::plotythe y coordinates of points in the plot, optional if
xis an appropriate structure.
Value
No return value, called for side effects